
The 2022 US midterm elections occurred less than two weeks ago. Like some of the midterm races at the time of this writing, the dominant narrative of the election cycle remains undecided, and competing explanations for the “red wave” that wasn’t vie for prominence. So far, we know that Republicans took control of the US House of Representatives with a very slim majority, while Democrats maintained and may even expand their tenuous hold in the US Senate. Taken together, this is likely the kindest midterm a Democratic president has weathered since Bill Clinton in 1998. The 2022 midterms also defied prognostications of a “red wave” for Republicans; with the notable exception of Florida, Democrats up and down the ballot beat expectations.
I aim to answer two questions here. First, what assumptions, shaped by historical knowledge and political science models, shaped predictions of a red wave? And second, why did the 2022 election defy those predictions? I argue that Donald Trump continues to warp the landscape of American politics. The Dobbs decision stripping a fundamental right from women (and a direct result of his presidency), Trump’s insistence on remaining in the news, and his leadership of the Republican Party effectively changed a referendum on President Joe Biden into one on former President Trump. Candidates associated with Trump underperformed and we are seeing real limits on the appeal of “Trumpism” to mainstream voters.
The Fundamentals: How History and Political Science Shaped Our Midterm Expectations
One of the academic findings on elections well known to the public is that the president’s party almost always loses seats in the midterms. Of the nineteen midterm elections held since the end of World War II, the president’s party has lost seats in seventeen of them. The two exceptions were 1998 and 2002. The GOP’s poor showing in 1998 is attributed to voter backlash to the Republicans’ handling of the Clinton-Lewinsky scandal, combined with the fact that the previous midterms (in 1994) had already significantly cut into Democratic congressional representation with little rebound in 1996. The lack of Democratic gains in 2002 reflected even more clearly a specific historical context: the September 11th attacks in 2001 and the “rally around the flag” effect.
Far more often, the party that controls the White House does poorly in midterm elections. Prominent recent examples include 1994, 2006, 2010, and 2018; in each of these midterms, the president’s party lost at least 35 seats in Congress. While there is broad agreement that midterms lead to losses for the president’s party, there is less consensus on why, with two types of explanations advanced most often. Behavioral explanations look at who shows up on Election Day (or increasingly, the days and weeks before), and who those voters select. Structural explanations deal with how the electoral system and political environment affect election outcomes.
Behavioral Explanations
Much of the work of 21st-century campaigns involves figuring out who is likely to support their candidate and getting those voters to the polls. The Obama presidential campaigns of 2008 and 2012 helped pioneer this approach by leveraging the growth of data on individuals in government records, social media, and commercial sources to customize their campaign at the level of the voter. The data-driven process by which campaigns choose to show ads on Facebook to specific voters, send volunteers to knock on someone’s door but not their neighbor, and run television ads for maximum impact is their innovation. While voting is habitual for many, others balance the costs of going to the polls against the expected benefits of their vote during each election. With midterms, the president’s party may struggle to convince supporters to vote because the benefits seem lower.
In a presidential election, the conventional wisdom goes, supporters of the president’s party turn out at high rates, motivated by excitement for their candidate. Their turnout also boosts congressional candidates in the president’s party. This so-called “surge” leads to the president’s party picking up seats in Congress. In contrast, during a midterm, supporters of the president’s party may stay home out of complacency or lack of motivation, while opposition voters are comparatively more energized. Candidates of the president’s party, who swept in during the presidential-election surge are vulnerable to challengers, leading to losses for the party that controls the White House.
Polling this year indicated a typical midterm enthusiasm gap, which favored Republicans. And while states tracking party registration reported large numbers of Democrats engaging in early or mail voting in the leadup to Election Day, it was apparent that at least some of this advantage derived from the fact that Democrats now favor early and mail voting options while Republicans prefer in-person, Election Day voting. Going into the election, there seemed ample reason to believe Democrats might stay home in 2022.
Along with the de-motivation of presidential party supporters, the political science literature on midterms also holds that persuadable voters may abandon that party in a midterm election. This “referendum” theory suggests that voters approaching a midterm election view it as a chance to weigh in on the incumbent president’s performance. An implication of this theory is that popular presidents presiding over a strong economy will suffer fewer losses than unpopular presidents presiding over a weak economy.
President Biden suffered from an anemic approval rate throughout the entirety of 2022; voter approval, according to FiveThirtyEight, never exceeded 43% while disapproval never fell below 50%. This is dangerous territory for a president during a midterm year.
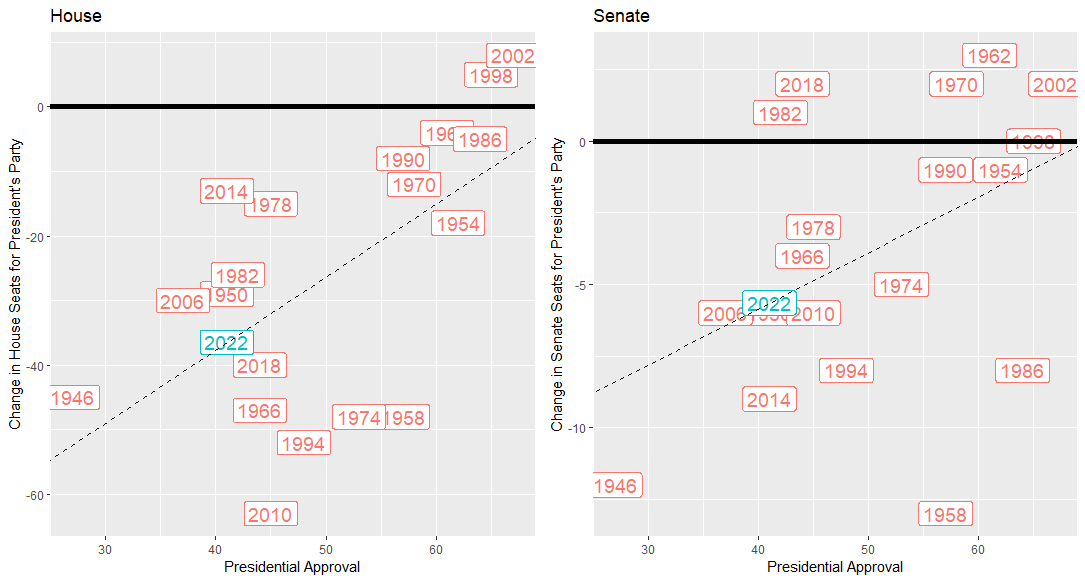
Unpopular Presidents Suffer Greater Congressional Losses in Midterms. Data from the UC Santa Barbara American Presidency Project. Projections and graphs by the author.
The figure above looks at the relationship between presidential approval and seat change for the president’s party in Congress for every midterm held since the end of World War II. On the right side of each graph above, midterms where the president was popular such as 1998 and 2002 led to few seats lost by the president’s party. In contrast, the left sides of the graphs where the president was unpopular, such as 1946 and 2006, led to large losses for the president’s party in both House and Senate. The dashed line in each graph takes all post-WWII midterms into account to calculate a general trend. I plotted a projection for 2022 (in blue) on this trendline based on Biden’s 41% approval going into the election. The historical data forecast the Democrats to lose 36 House seats and 5 Senate seats in 2022.
Structural Explanations
Several factors outside the scope of voter behavior affect midterm election outcomes. First, because not all Senate seats are up for election in any single election year and not all House seats are controlled by the president’s party, the president’s party defends a different number of seats in each election, which serves to increase or limit electoral risk. In post-World War II midterms, the president’s party has defended anywhere between seven and twenty-two Senate seats and between 175 and 295 House seats.[1] Historically, this level of “exposure” predicts seat loss for the president’s party. The figure below plots historical numbers of seats up for election against change in seats for the president’s party for post-World War II midterms, and it predicts 2022 outcomes for the Democrats based on this trend.
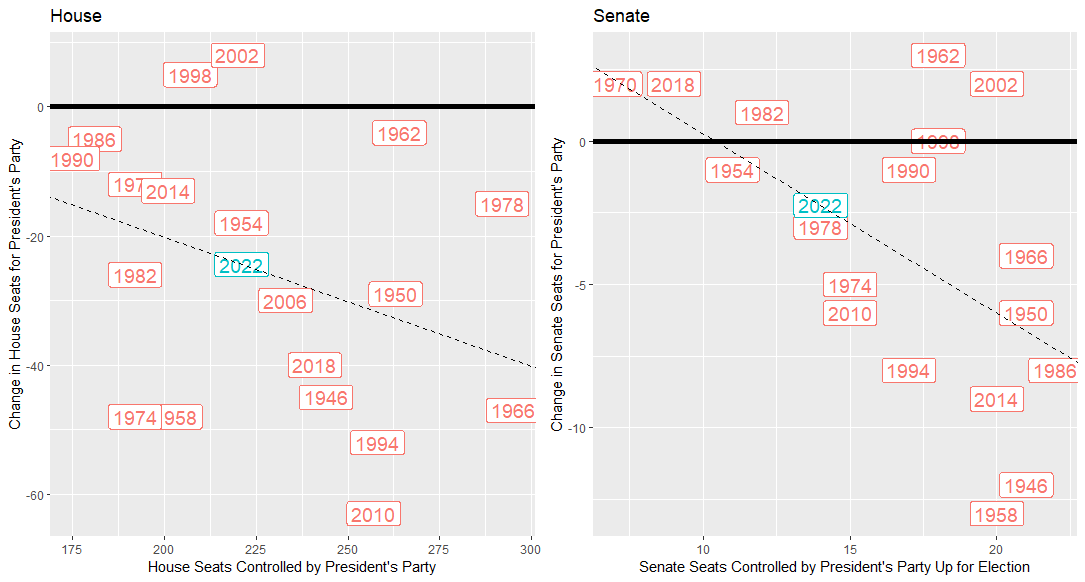
More Exposed Parties Suffer Greater Midterm Losses. Data from the UC Santa Barbara American Presidency Project. Projections and graphs by the author.
This picture is slightly sunnier for the Democratic Party than the behavioral prediction, especially in the Senate where they defended fewer seats than average in 2022. Still, the prediction had Democrats losing 24 House seats and 2 Senate seats in 2022.
Finally, because many political actors affecting election outcomes are strategic, a public perception of a bad midterm for a party may become a reality. Candidates, especially good candidates who already hold office and can credibly challenge incumbent members of Congress, maximize their chances of success. A failed run for higher office can damage the career of a rising star. Thus, a Republican state senator hoping to challenge a vulnerable Democratic Representative in Congress might wait until the wind is at their back to risk their career. Therefore, quality candidates and formidable challenges to vulnerable members of the president’s party tend to appear when those members can least afford to face them—during midterms such as 2022.
These “fundamentals” of midterms boded ill for the Democrats in 2022. While the picture in the Senate seemed slightly sunnier than the picture in the House, history indicated an uphill battle for the president’s party. So why didn’t the red wave materialize?
Why 2022 Was Different
While pundits ahead of the midterms were determined to stick to the fundamentals, voter turnout, the Dobbs decision, Donald Trump, and the low quality of Republican candidates proved to be more important factors. (A caveat: additional factors likely influenced the midterm outcome, including the 2020 redistricting cycle—which easily warrants its own essay—and the youth vote, but it will be several months before reliable age data on the composition of the electorate become available from voter files.)
Turnout, especially in Senate Battleground States
While final estimates of voter turnout remain to be tabulated, preliminary results suggest over 46% of eligible Americans voted in the midterms. While this rate lags behind the 50.0% of 2018, it is the second highest midterm-turnout rate in the 21st century by a roughly 5-point margin. In particular, the 2022 Senate battleground states had exceptionally high turnout (and as a result saw less of a midterm decline this year).[2]
| Average 2022 Turnout | Change from 2020 Presidential Turnout | Change from 2018 Midterm Turnout | |
| Senate Battleground | 52.7% | -18.5% | -0.3% |
| Not Senate Battleground | 48.1% | -20.0% | -4.0% |
| Difference | +4.6% | +1.5% | +3.7% |
Senate Battlegrounds Had Higher Turnout in 2022 and Smaller Declines from Previous Years. Data from the US Elections Project. Analysis by the author.
The nine Senate battleground states in 2022 had an average turnout of 52.7%, compared to 48.1% for states that did not have a competitive Senate race.[3] While all states saw turnout decline significantly from the 2020 presidential election, the decline was smaller in the 2022 Senate battlegrounds. This latter finding is even more remarkable given that given that virtually all of these 2022 Senate battlegrounds were also presidential battlegrounds in 2020; in other words, both parties deployed significant get-out-the-vote operations, boosting the 2020 turnout.
Dobbs
On June 24, 2022, the Supreme Court overturned Roe v. Wade (1973) with its decision in Dobbs v. Jackson Women’s Health Organization (2022), and the constitutional right to an abortion that Roe granted was ended. The elimination of a fundamental right for women, the questionable legal and historical grounds of the decision, and the quick action of many Republican-controlled states to curtail reproductive freedom assured that reproductive rights would be a Democratic midterm issue.
A report on voter registration by the progressive data firm Catalist suggests that both the leaking of the draft Dobbs opinion on May 2, 2022 and the actual decision the next month motivated unregistered women across the country to register to vote, especially in Senate battleground states. These data also suggest that those registering in the wake of Dobbs were disproportionately likely to register as Democrats.
An early test of whether Dobbs would make an electoral difference occurred in Kansas during its August 2, 2022 primary, which included a ballot measure that would have eliminated the constitutional right to an abortion in the state. Voters, who turned out in record numbers, defeated the measure in a decisive 59% to 41% vote. This shocking result in red Kansas served notice to political observers that abortion and reproductive rights would be a salient issue in a midterm election otherwise viewed as a critical referendum on the president.
While exit polls should be interpreted with caution until final vote totals allow pollsters to weight them properly, they offer clues regarding the importance of abortion in the 2022 midterms. Among the 37% of voters responding to the exit poll who expressed positive feelings about the overturning of Roe, 87% voted Republican. Among the 61% who expressed negative feelings about Roe’s overturning, 71% supported the Democrats. That 61% majority, with 71% Democratic, suggests Dobbs was a very important factor in turning out voters for the Democrats. Moreover, exit polling showed 27% of voters considered abortion the most important issue; overall, the percentage of voters who prioritized abortion were second only to voters who cited inflation (31%). Among voters who said abortion was the most important issue, 76% supported the Democrats. All of this suggests that widespread support for women’s reproductive autonomy turned out voters in high numbers for the Democrats. While public opinion on abortion is nuanced, only a minority of Americans support the complete bans many states now seem poised to enact. By activating this as a political issue in 2022, the Supreme Court inadvertently motivated a pro-choice majority to counter the red wave.
The Role of Trump
Former President Donald Trump continues to loom large over American politics, especially the Republican Party. His endorsement was widely sought by 2022 Republican candidates. A polarizing figure disliked by a majority of Americans, the polling data from the 2022 midterms suggests Trump played a role in their outcome.
According to exit poll data, a similar percentage of voters were motivated by negative views of Biden and negative views of Trump. While 32% of voters described their vote for a US House representative as a vote to oppose President Biden, 28% described their House vote as a vote to oppose former President Trump. Nearly half of exit poll respondents (47%) reported that Biden was not a factor in their vote. These are unusual results that cut against the logic that midterms are referendums on the incumbent president. Voters motivated by their opposition to Trump (a far more visible ex-president than most) effectively nullified the usually significant portion of the electorate motivated by opposition to a sitting president.
We can compare these results to exit polling in a more typical midterm—2018—which was indisputably a referendum on then-President Trump. The same question was asked of exit poll respondents in 2018 regarding their US House vote. In 2018, 38% of voters reported that their vote was against Trump (to 2022’s 32% against Biden), and just 33% of respondents said Trump was not a factor (compared to 47% who said Biden was not a factor in 2022). The 2018 results are much more in line with the usual midterm election patterns and mark 2022 as a deviation.
| US House vote to… | Biden, 2022 Exit Poll | Trump, 2018 Exit Poll |
| Support President | 19% | 26% |
| Oppose President | 32% | 38% |
| President not a Factor | 47% | 33% |
More Voters in 2022 Did Not Consider the Incumbent President in Their VoteData from exit polls of 2018 and 2022.
Quality Candidates
A final factor in the 2022 midterms was the lack of quality Republican candidates. This development reflects recent history in the Republican Party, namely, Donald Trump’s victories in the 2016 Republican primary and general election. The lesson that many Republicans took from 2016 was that a political outsider could prevail in important American electoral races.
Since then, polling and primary results indicate a desire by Republican voters to choose outsiders rather than candidates with political experience. This shaped the slate of 2022 Republican candidates, particularly in the Senate battlegrounds. Of the nine states with Senate battlegrounds in 2022, only three Republican nominees (including incumbent Senator Ron Johnson) had previously held elected office.
However, preferences for “outsider” candidates among Republicans does not necessarily translate to those candidates winning general elections. In fact, in comparing the vote margins for the three experienced candidates to the six inexperienced candidates in the battleground states, the experienced candidates did about 3-percentage points better than the inexperienced ones. This discrepancy cannot be solely due to candidates residing in more (or less) Republican states—each of the experienced candidates overperformed Trump’s 2020 numbers in their state by almost 1 point while the inexperienced candidates underperformed Trump’s 2020 numbers by about 1 point. While these differences are small, they are meaningful in close races. The overperformance of experienced candidates is consistent with research showing they historically do better in elections.
| Average GOP Two-Party Vote Share 2022 in State | Average Trump Two-Party Vote Share 2020 in State | Average Difference | |
| Experienced GOP Senate Candidates | 50.61% | 49.71% | +0.90% |
| Inexperienced GOP Senate Candidates | 47.63% | 48.75% | -1.12% |
| Difference | +2.98% | +0.96% | +2.02% |
Experienced Battleground Senate Candidates Overperformed Trump in Their State in 2020, Inexperienced Candidates Underperformed. Data from final presidential results in 2020 and preliminary Senate results in 2022. Senate battlegrounds only.
Conclusion
Pundits predicting the outcome of the 2022 election could be forgiven for looking to previous midterms for guidance and predicting a Red Wave. The fundamentals certainly boded ill for Democrats
The surge of 2020 that brought President Biden to office receded less than Democrats feared and Republicans hoped. While Republicans worked hard to frame the midterms as a traditional referendum on Biden and the economy, the Dobbs decision and former President Trump’s desire to remain in the news thwarted that effort and mobilized enough Democrats to limit the GOP’s gains. And the Republican primary electorate’s collective decision to run inexperienced candidates in key Senate races likely played a major role in the outcome of those races.
Since Donald Trump arrived on the political scene in 2016 and unexpectedly became president, Americans politics has been abnormal. Hyper-charged partisanship and polarization combined with a former president who does not respect democratic nor governmental norms resulted in a toxic combination that has threatened American democracy. While Trump’s hold over the Republican base appears firm for now, this midterm result suggests that his continued presence in politics presents real limitations for Republicans.
Featured image: “Red Trump Wave” by Rick McKee, published September 13, 2022, on Cagle Cartoons.
[1] These data from the UC Santa Barbara American Presidency Project show Republicans defended seven seats in 1970 compared to twenty-two in 1986. In the House this ranged from Republicans defending 175 seats in the 1990 midterms to Democrats defending 295 seats in 1966.
[2] The Senate battleground states are defined here as the nine states rated “Lean” or “Toss Up” by the Cook Political Report: AZ, CO, GA, NH, NV, NC, OH, PA, and WI.
[3] This difference of almost five points is especially significant because several of the “non-battleground” states had competitive races for governor or important ballot initiatives. Compared to the historical high turnout of the 2018 midterms, turnout in the Senate battlegrounds declined only 0.3% from 2018 to 2022, compared to a 4-point decline within non-Senate battleground states from the 2018 midterm.

Leave a comment